Power cost estimator
A 40 W box running all day costs about $5/month at $0.17/kWh. Enter your watts and rate below for your exact number, or compare two setups over 3 years.
Updated 2026-09-23 · Default rate checked 2026-09-23 · Sources below
Built-in checks: running…
Use it in 3 steps
- Find your watts. A plug meter week gives the true average (see how to measure). No meter yet? Start from the typical setups below, then replace the guess once you measure.
- Find your true $/kWh. Take last month’s bill total in dollars and divide by total kWh. That all-in rate beats the headline rate because it includes fees and taxes. Type it into the rate box.
- Compare two setups. Tick the compare box and enter the second box’s watts. The 3-year gap tells you whether the efficient upgrade pays for itself, and when.
What typical setups cost
| Setup | Avg watts | Per year at $0.17/kWh |
|---|---|---|
| Mini PC NAS | 15 W | $22 |
| Prebuilt 2-bay | 20 W | $30 |
| DIY, desktop parts | 45 W | $67 |
| Used office PC server | 80 W | $119 |
| Used rack server | 120 W | $179 |
Swap in your rate and the numbers move. At $0.30/kWh (common in parts of Europe and California), the rack server row passes $300 a year. That is why step 2 matters more than step 1.
Quick answers
Where do I find my $/kWh rate?
On your power bill: total dollars divided by total kWh. That all-in number includes delivery fees and taxes, so it beats the advertised supply rate for planning.
My brick says 300 W. Should I type that?
No. The brick label is the max the supply can give, not what your box draws. Real 24/7 averages sit far lower. Measure with a plug meter for the true number.
Why is my real bill higher than the estimate?
Flat-rate math misses tiered pricing, demand charges, and taxes. The estimator plans comparisons, not bills. Your bill always wins.
What is the CO2 number based on?
A rough 0.37 kg per kWh factor, dated 2026-09-23. Grids differ a lot, so treat it as order-of-magnitude, not audit data. We re-check yearly.
How does the 3-year compare work?
Tick the compare box, enter setup B’s watts, and the tool shows (yearly A minus yearly B) times 3. Positive means B saves that much over three years.
Go deeper
- Measure your idle watts — the week-long meter method.
- Used server vs mini PC — what the dollars mean for buying.
- EIA Electric Power Monthly — US rate context behind our default.
How we work it out
Blend mode first: average watts = idle + (load − idle) × load share. Then kWh per day = watts × 24 / 1000. Times 365 gives kWh per year. Times your rate gives cost per year. Divide by 12 for cost per month. The 3-year gap is just (yearly A − yearly B) × 3.
The $0.17 default is a US home benchmark, dated 2026-09-23. EIA data for mid-2026 ran a bit higher, near $0.18–0.19/kWh, so treat $0.17 as a low-ish start and type in your own bill rate. CO2 uses 0.37 kg/kWh, a rough factor, also dated. We re-check yearly.
A common mistake is using the label on the power brick. That number is the max, not the draw. For most people the real 24/7 average sits far lower. Measure idle watts with a plug meter (see how to measure) and type that in.
How we check our work
- Data: EIA Electric Power Monthly for rate context; $0.17 is our low-ish start rate.
- Math: rules in “How we work it out” above; code in power-estimator.bdf6938e.js.
- Tests: 10 known-answer cases pass in the page itself.
- Fresh: last check 2026-09-23; we re-check each year.
- Limits: your bill rate wins; brick labels show max draw, not real use.
Sources
- EIA Electric Power Monthly (rate benchmark context)
- PracticalHomelab: homelab electricity cost
- BudgetHomelab: homelab power usage
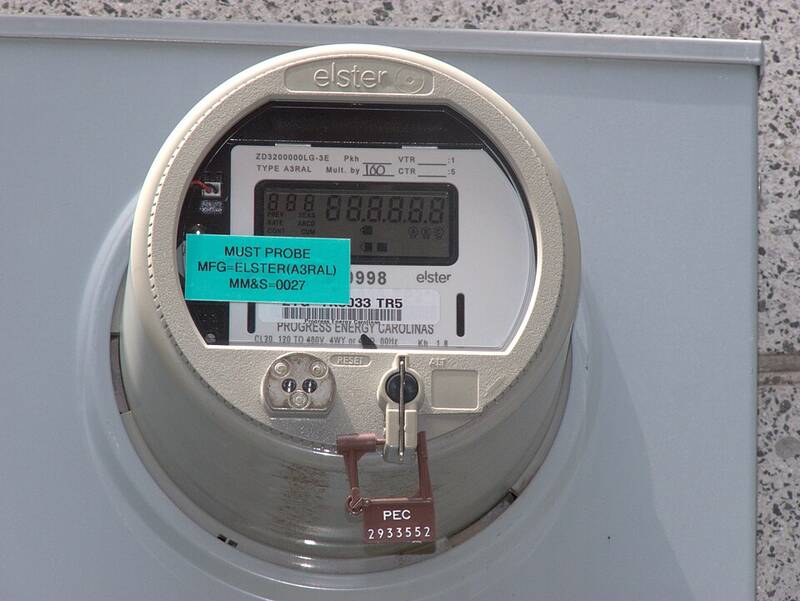
- Photo: 277volts, CC BY-SA 4.0, via Wikimedia Commons

Was this helpful?
Spot an error?